9.7. スクリーニング検査としてのROC
スクリーニング検査などで正常者と異常者を分ける場合には、検査の性能を知るために色々な指標があります。
2×2分割表から、
敏感度(sensitivity)、特異度(specificity)、有病率(prevalence)、陽性反応的中度(positive predictive value)、
陰性反応的中度(negative predictive value)・・・・などを求めます。
これらの指標は下記URL(Web online soft )を利用すると便利でしょう。
EpiMax Table Calculator :
Clinical Calculator 1:
Web online soft での 95%信頼限界は多くの場合、推測ですが正規近似式が使われており online soft によりそれぞれの異なりますので注意が必要です。
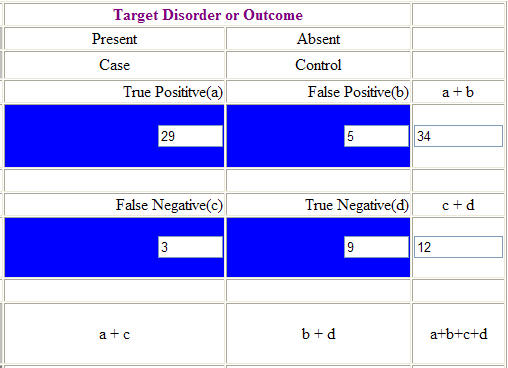
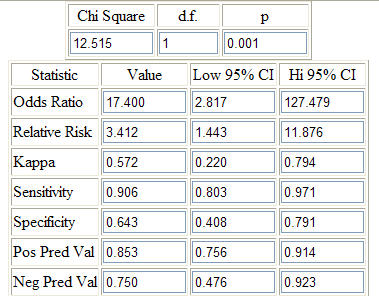
「EpiMax Table Calculator」の結果は次の通りです。
入力画面(一部)

出力画面(一部)

下記のMS-Excel ファイル(ROC_index_2.xls)に関数による計算方法をまとめていますので参考にして下さい。
ROC_index_2.xls
正確な95%信頼限界の計算には、上記の「F分布による方法」をお勧めします。
例題「前章(9.6.)の出力結果」(医学と統計(93)参照)を用いて各種指標を求めて見ましょう。
出力結果
| ......... | True(0) | True(1) |
| Predicted(0) | 9 | 3 |
| Predicted(1) | 5 | 29 |
上記の出力結果を分かり易い次の様な「R」の入力フォームにします。
| ......... | True(1) | True(0) |
| Predicted(1). | 29 | 5 |
| Predicted(0). | 3 | 9 |
● 統計解析環境「R」による方法。
library(epiR)
dat <- as.table(matrix(c(29, 5, 3, 9), nrow = 2, byrow = TRUE))
colnames(dat) <- c("True(1)","True(0)")
rownames(dat) <- c("Predicted(1)","Predicted(0)")
dat
epi.tests(dat, conf.level = 0.95, verbose = FALSE)
出力結果
> epi.tests(dat, conf.level = 0.95, verbose = FALSE)
| ....... | Disease + | Disease - | Total |
| Test + | 29 | 5 | 34 |
| Test - | 3 | 9 | 12 |
| Total | 32 | 14 | 46 |
Point estimates and 95 % CIs:
---------------------------------------------------------
| Apparent prevalence | 0.74 (0.59, 0.86) |
| True prevalence | 0.7 (0.54, 0.82) |
| Sensitivity | 0.91 (0.75, 0.98) |
| Specificity | 0.64 (0.35, 0.87) |
| Positive predictive value | 0.85 (0.69, 0.95) |
| Negative predictive value | 0.75 (0.43, 0.95) |
PPVとNPVは有病率(事前確率)によって変わります。有病率の至適基準が分かっていれば
次の「R」コマンドで有病率を変えて検討する事が出来ます。
library(bdpv)
dat<-matrix(c(29, 5, 3, 9), nrow = 2, byrow = TRUE)
colnames(dat)<-c("True(1)","True(0)")
rownames(dat)<-c("Predicted(1)","Predicted(0)")
dat
BDtest(xmat=dat, pr=0.5, conf.level = 0.95)
出力結果
BDtest(xmat=dat, pr=0.5, conf.level = 0.95)
Confidence intervals for binary diagnostic tests.
Input data set with columns representing the true property of the compounds and rows representing
the result of a binary diagnostic test.
| .... | True positive | True negative |
| Test positive | 29 | 5 |
| Test negative | 3 | 9 |
Estimates and exact confidence limits for assay sensitivity and specificity.
| ..... | Estimate | Lower 95% limit | Lower 97.5% limit | Upper 97.5% limit |
| Sensitivity | 0.9062500 | 0.7751839 | 0.7497730 | 0.9802328 |
| Specificity | 0.6428571 | 0.3904149 | 0.3513801 | 0.8724016 |
Estimates and asymptotic confidence limits for predictive values.
The prevalence is assumed to be 0.5.
| .......... | | Lower 97.5% limit | Upper 97.5% limit | |
| NPV 0.8727273 | 0.7238614. | 0.6855683. | 0.9556848 |
| PPV 0.7173145 | 0.5827366 | 0.5546847 | 0.8379076 |
● MS-Excel 関数による方法(自作)
下記のURLからMS-Excelファイル(ROC_index_2.xls)をダウンロードして各種指標とその95%信頼限界を求める事が出来ます。
「正規近似による方法」と「F分布による方法」がありますが、少数データのときは「F分布による方法」をお勧めします。
ダウンロード先URL: ここから
戻る 次へ 目次へ TOPへ